January 31 2023
1 Min Read

From “Zero Interest Rate Policies” to “higher for longer” and “higher forever”: what should investors do in changing rate environments?
Recent years have witnessed interest rate extremes. The Fed drove the most rapid increase in short-term rates in four decades between March 2022 and July 20231, ending the zero interest rate policies that followed the Great Financial Crisis and the pandemic.
Furthermore, the volatility in the broader markets provided additional excitement to the roller coaster ride of 2023. Bond prices fell for much of the year as the 10-Year U.S. Treasury Note reached a 17-year high of nearly 5% in October. By year-end, reversal in the fixed income markets took the 10-year back to its starting yield for the year of approximately 3.8%.2
This rate environment whipsaw has been challenging to fixed income investors who have historically looked to this asset class for stability and consistency. We have observed that CLO equity, with high potential cash flows and low interest rate sensitivity, may offer a distinctive edge in a changing interest rate environment.
To understand the value proposition of CLO equity, it is helpful to review the structure of collateralized loan obligations (CLOs) first.
Most of the securities issued by a collateralized loan obligation, apart from CLO equity, are CLO debt securities. These securities offer investors a comparatively high level of floating rate income and priced at a spread above short-term rates. Each CLO debt security’s spread is based on the credit risk, rating, and the priority of the claim a debt tranche may have on interest and principal payments of the loans held in the portfolio. CLO debt securities are popular with investors seeking a floating rate investment.
The proceeds from the sale of these CLO debt tranches provide a CLO manager with most of the capital to buy a portfolio of leveraged loans. The remaining capital comes from CLO equity investors. In general, CLO debt investors provide 90% of the capital and the CLO equity investors provide 10%.
What do the CLO equity investors get? They receive the residual interest from the portfolio of leveraged loans after payments of interest to the CLO debt tranches, as well as any expenses. This residual interest or arbitrage drives returns for CLO equity.
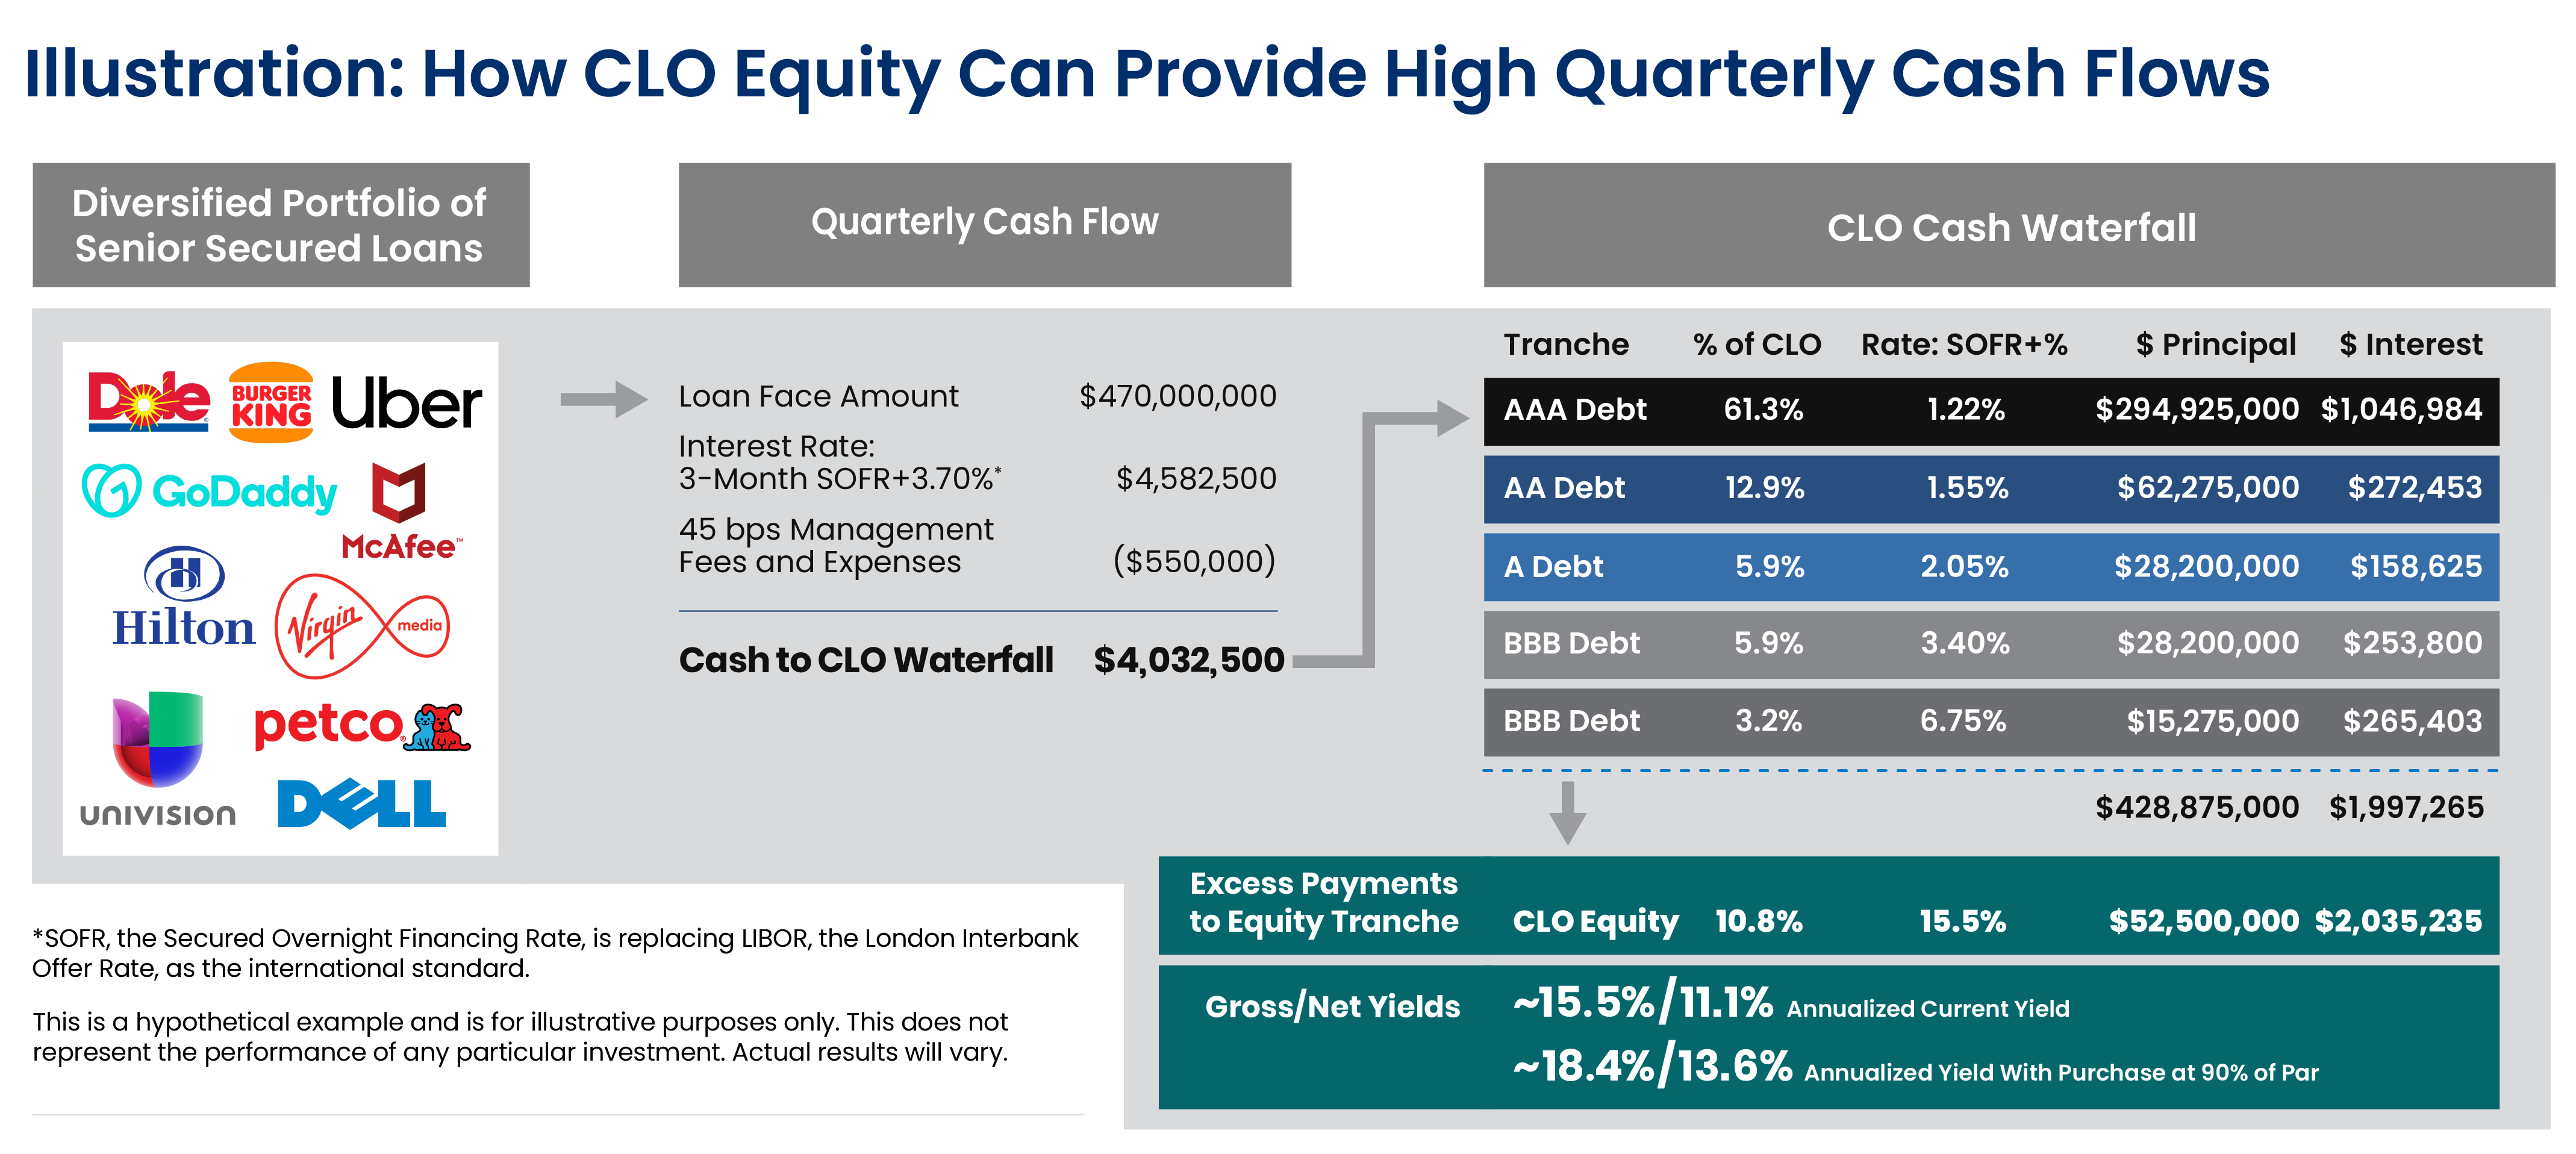
Note: Hypothetical example. For illustration only. Assumes an equity purchase price of 90% of par. Does not represent the performance of any particular investment. Actual results may vary. CLO equity investments are subject to high levels of risk. Net amounts reflect deductions for fund related expenses, management fees, and incentive fees. For fund related expenses, ongoing annual expenses are estimated at $0.1 million. The assumed management fee is 1.65% annually with a 15% incentive fee over an 8% hurdle (with a 100% catch up).
Source: Clarion Capital Partners
What returns are available to CLO equity from this residual interest or arbitrage?
Let’s start with the underlying loans as the source of potential interest income. The collateral pool contains a diversified portfolio of hundreds of leveraged loans to major U.S. companies across dozens of industries. These loans pay a floating rate coupon, based on a spread over SOFR (Secured Overnight Financing Rate), a short-term reference rate.
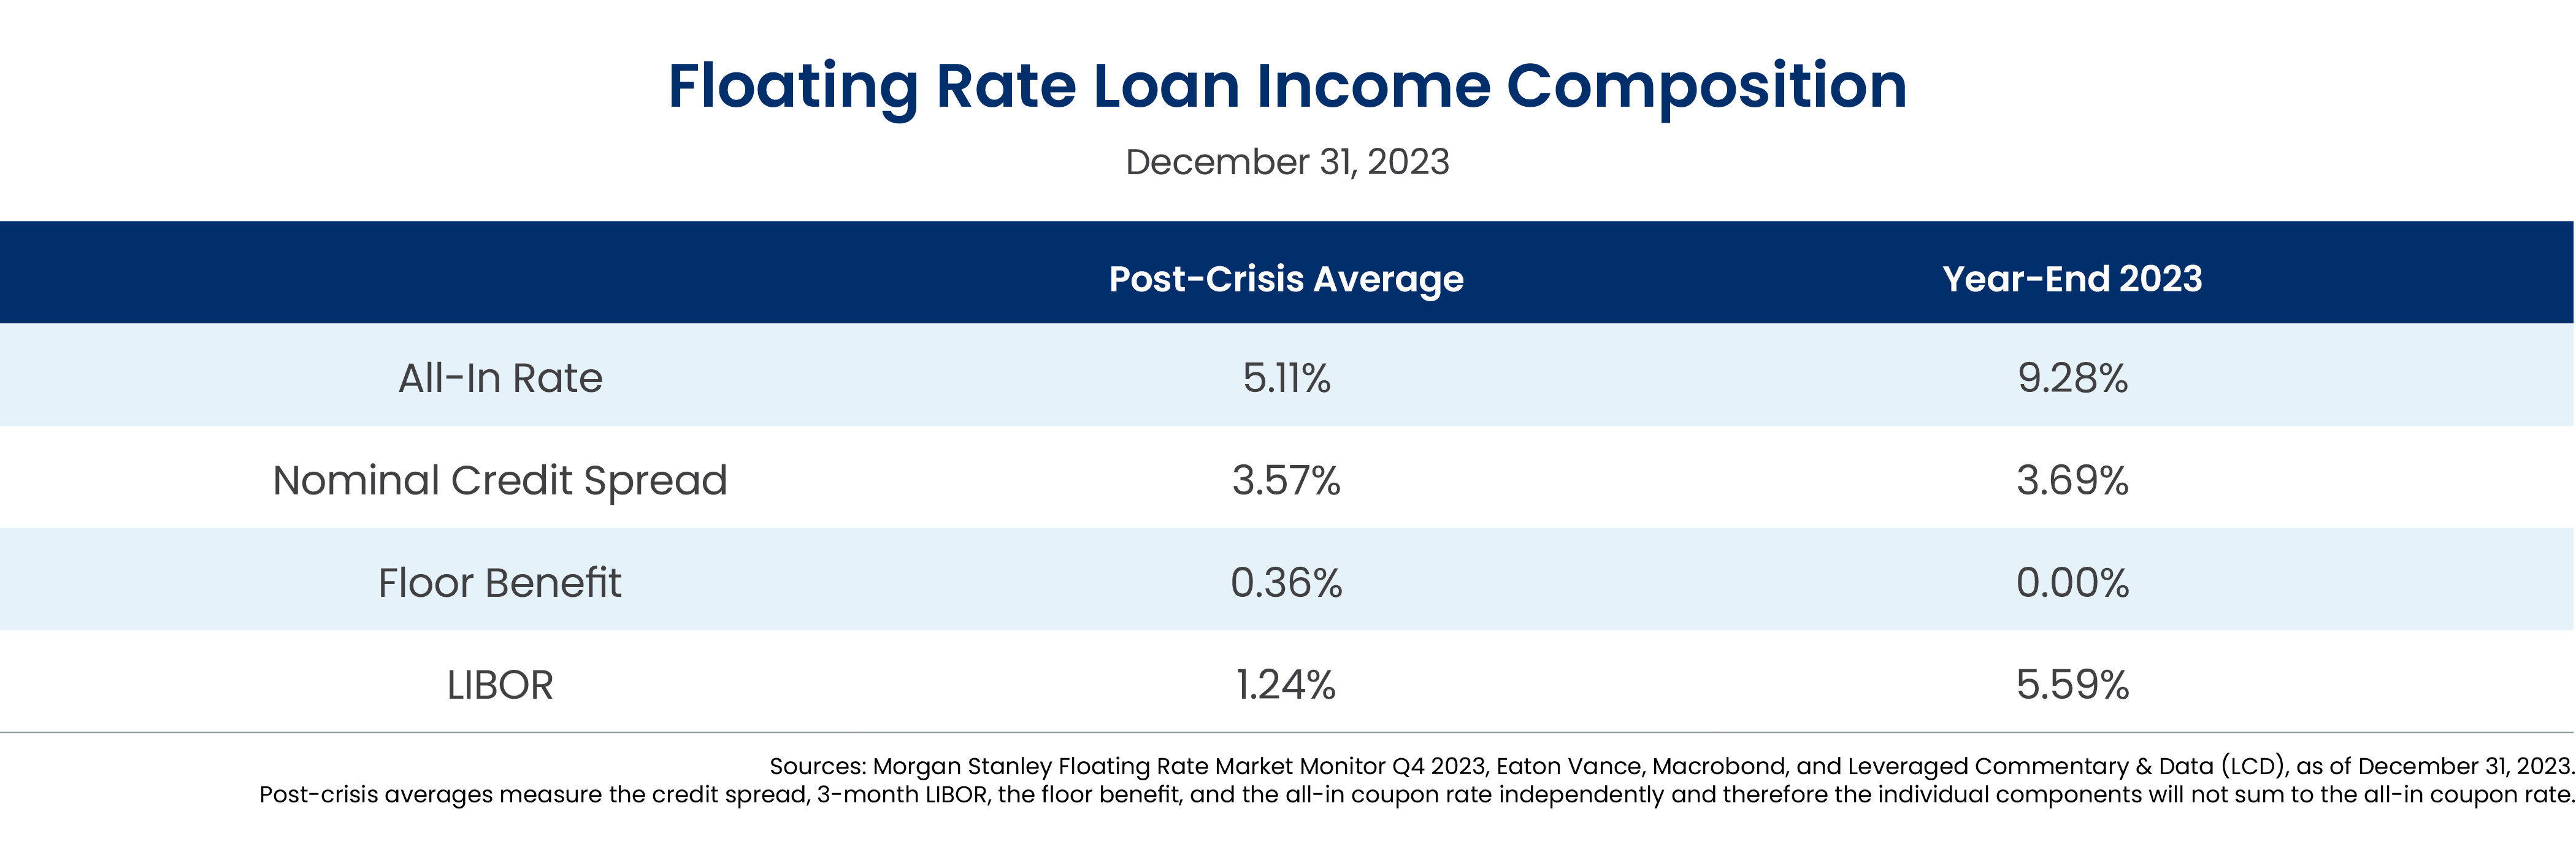
We can calculate the weighted average spread for this loan pool, a critical number as it represents the income received by the loans in the portfolio overall. The total average coupon rate for leveraged loans recently reached 9.28%, based on a spread of 3.69% over the base rate. This compares favorably to a post-crisis average of 5.11%, which included an interest rate floor above the base rate since rates were near zero for so long.
To finance the purchase of the loan portfolio, the CLO will issue debt tranches rated from AAA to BB (or B, less frequently). The AAA tranche is usually the largest, accounting for over 60% of the balance of the debt tranches. AAA CLOs recently provided yields over 6% based on an average spread of approximately 1.75% over the base rate.3
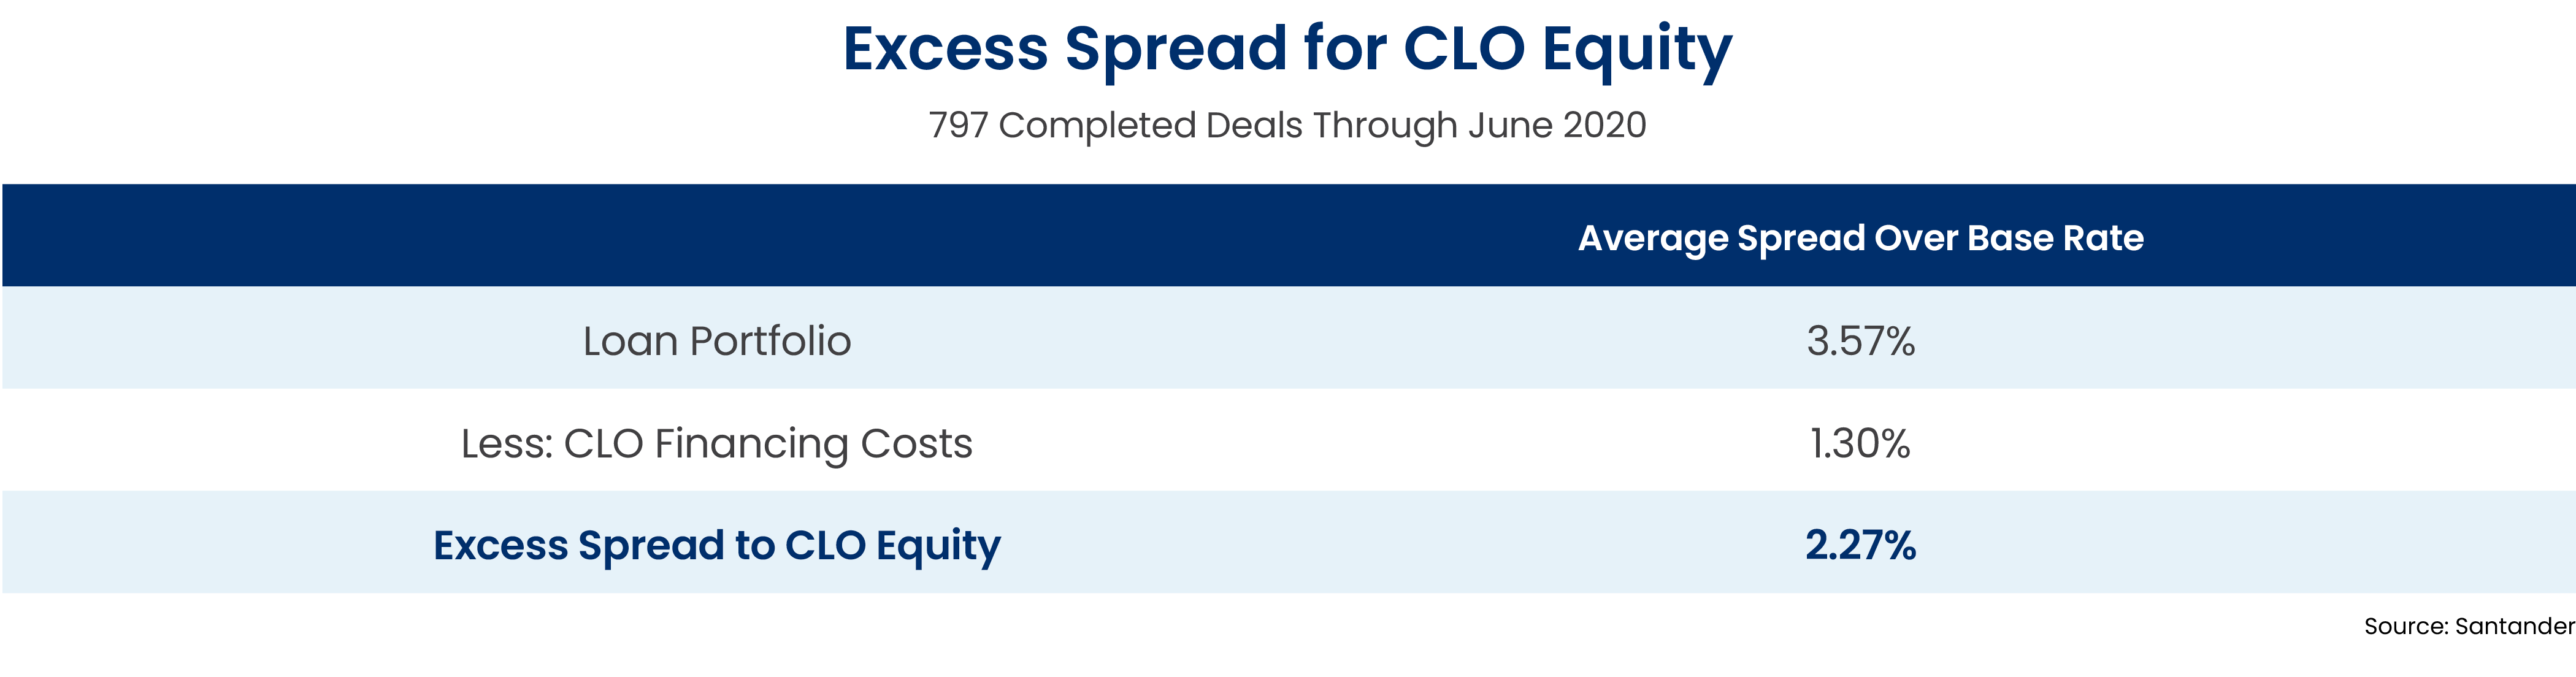
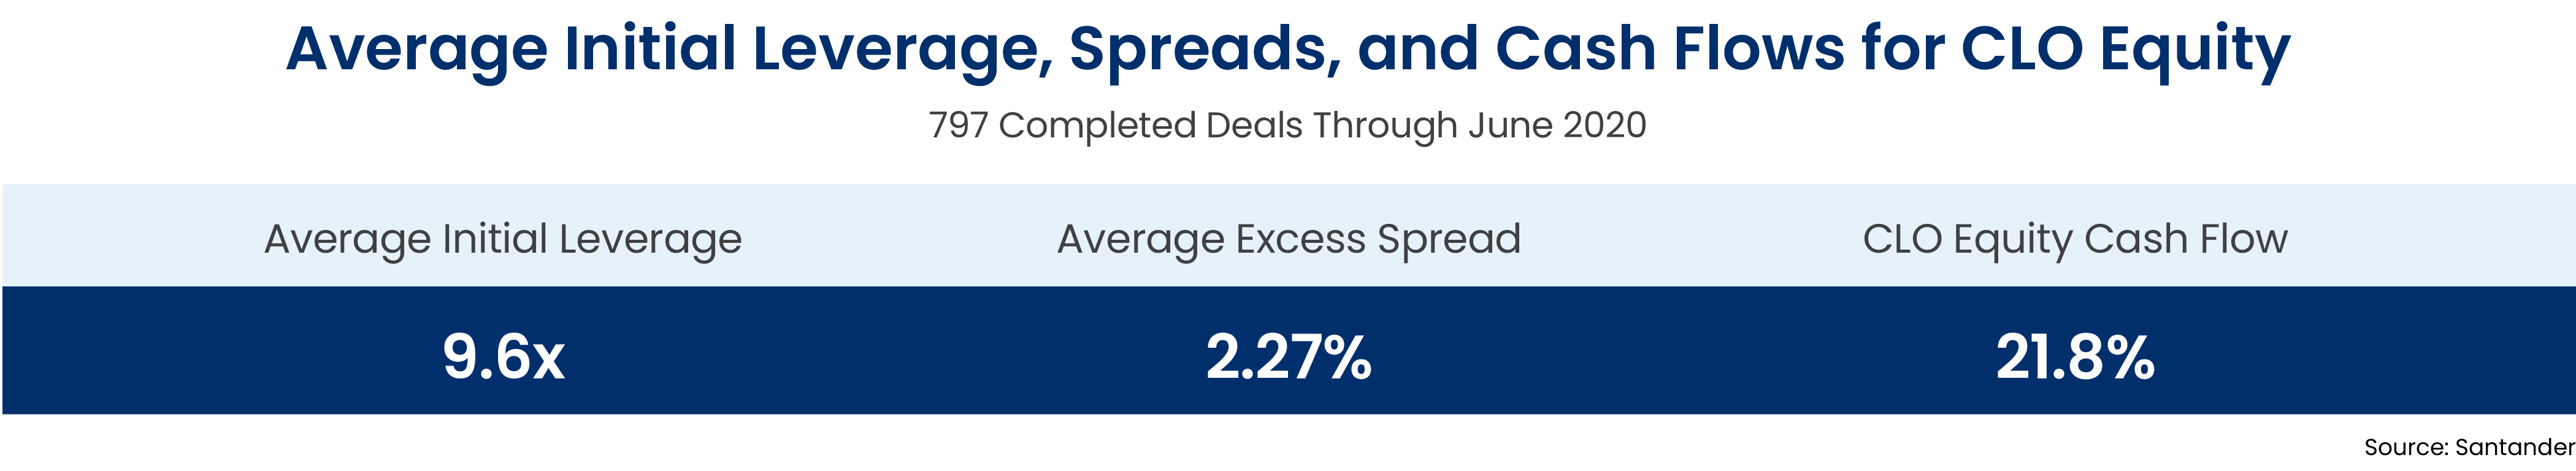
CLO equity gets to keep the residual interest from the loan pool after payments to the CLO debt tranches. A study of 797 CLOs completed through June 2020 indicated an average spread on CLO loan portfolios of 3.57%. The average cost of capital for the debt tranches was a spread of 1.30% over the base rate. In this sample group, CLO equity was able to earn an average excess spread of 2.27%.4
Note that the CLO structure is levered. This leverage is important to the cash flows and returns to the CLO equity as it amplifies the excess spread.
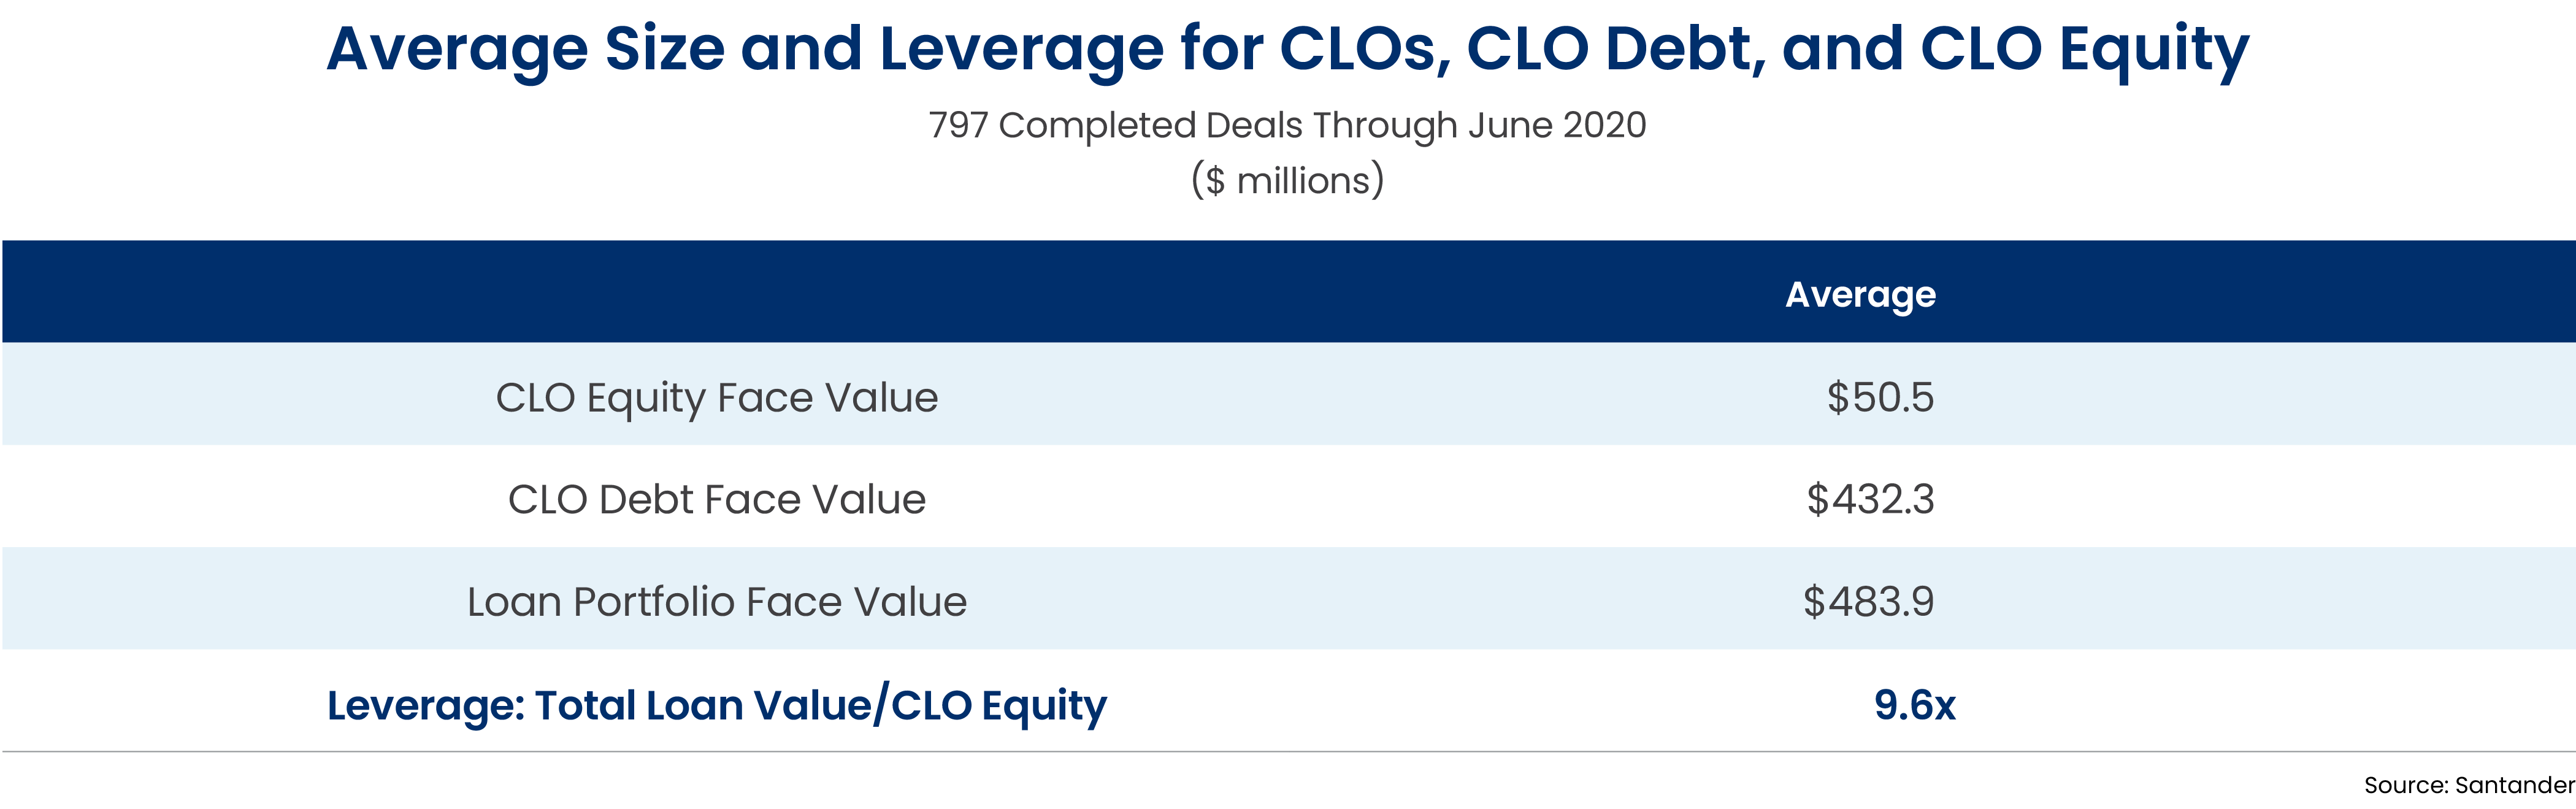
The average CLO in this sample group had (approximately) $484 million of loans, financed by $432 million of debt and $51 million of equity.5 The CLO equity in the sample group had an average leverage multiple of 9.6x (nearly 10x). This equates to cash flows for the average CLO equity tranche in the sample group of 21.8%, or 9.6 times the average excess spread of 2.27%.
As illustrated above, the excess spread is critical in determining the ultimate cash flows to CLO Equity. As the loan portfolio and debt financing are both floating rate, the spread and not the base rate is the driver of returns for CLO equity.
Excess spread may drive cash flows available to CLO equity. However, market conditions and CLO manager risk management can impact these cash flows during the life of the CLO.
Market conditions can impact CLO equity cash flows over time. For example, some leveraged loans in the CLO portfolio may default, negatively impacting CLO equity cash flows and total returns.
A CLO manager can also make a significant difference in capturing opportunities or mitigating risk, leading to bifurcation in returns for CLO equity over time. Managers can trade the loan collateral portfolio during the CLO’s reinvestment period to pursue income opportunities and trading profits, or to manage risk. This trading activity can be a positive driver of returns. Conversely, poor risk management or trading can lead to underperformance.
As illustrated above, the structure and characteristics of CLO equity results in an investment with reduced interest rate sensitivity. In this way, CLO equity may provide investors with an edge in a fluctuating interest rate environment.
To learn more about the distinctive return potential and risks of CLO equity, and how the asset class may complement your portfolio, please contact the Clarion Structured Credit team for an in-depth discussion.

1. Felix Richter, “The Most Aggressive Tightening Cycle in Decades,” Statista, December 14, 2023. https://www.statista.com/chart/28437/interest-rate-hikes-in-past-tightening-cycles/
2. Tom Lauricella, Lauren Solberg, “15 Charts On the Surprise ‘Everything Rally’ for 2023,” Morningstar, January 2, 2024. https://www.morningstar.com/markets/15-charts-surprise-everything-rally-2023
3. Christopher Sheldon and Rory O'Farrell, “2024: A Credit Vintage to Remember?”, KKR Credit & Markets Review, December 2023, p. 9. https://www.kkr.com/content/dam/kkr/insights/pdf/2024-a-credit-vintage-to-remember.pdf
4. Steven Abrahams and Caroline Chen, “A Quick Guide to CLO Debt and Equity: Chapter V, Evaluating CLO Equity”, Santander, 2023. https://portfolio-strategy.apsec.com/a-quick-guide-to-clo-debt-and-equity/chapter-v/
5. Abrams and Chen.
Check out our related posts based on your search that you may like